Thermoelectric Transport Properties
Here code examples for thermoelectric transport properties are given. It is developed for the ‘BOLTZTRA’ keyword of CRYSTAL properties calculation.
The ‘read_transport()’ method
This method is defined in the crystal_io.Properties_output class, which reads the ‘DAT’ formatted files (‘KAPPA.DAT’, ‘SIGMA.DAT’, ‘SIGMAS.DAT’, ‘SEEBECK.DAT’ and ‘TDF.DAT’) generated by CRYSTAL and return to classes based on transport.Tensor (‘KAPPA’, ‘SIGMA’, ‘SIGMAS’ and ‘SEEBECK’) or based ontransport.Distribution (‘TDF’).
Currently the standard output is not required for plotting. But its geometry information will be saved if given.
[1]:
from CRYSTALpytools.crystal_io import Properties_output

obj = Properties_output('trans_G2S.out').read_transport('trans_G2S_SK.DAT')
print('Object type: {}'.format(obj.type))
print('Temperature (K):')
print(obj.T)
print('Chemical Potential (eV):')
print(obj.mu)
print('Geometry:')
print(obj.struc)
Object type: SEEBECK
Temperature (K):
[300. 310. 320. 330. 340. 350. 360. 370. 380. 390. 400. 410. 420. 430.
 440. 450. 460. 470. 480. 490. 500.]
Chemical Potential (eV):
[-4.84 -4.74 -4.64 -4.54 -4.44 -4.34 -4.24 -4.14 -4.04 -3.94 -3.84 -3.74
 -3.64 -3.54 -3.44 -3.34 -3.24 -3.14 -3.04 -2.94 -2.84 -2.74 -2.64 -2.54
 -2.44 -2.34 -2.24 -2.14 -2.04 -1.94 -1.84]
Geometry:
Full Formula (C48 S2)
Reduced Formula: C24S
abc   :  12.251302  12.223170 500.000000
angles:  90.000000  90.000000 119.924043
pbc   :       True       True      False
Sites (50)
  #  SP            a          b          c
---  ----  ---------  ---------  ---------
  0  C     -0.130438   0.133993   0.000898
  1  C     -0.133358   0.332481  -5.6e-05
  2  C     -0.133358  -0.465839  -5.6e-05
  3  C     -0.130438  -0.264431   0.000898
  4  C      0.072706  -0.066403   0.000264
  5  C      0.072706   0.139109   0.000264
  6  C      0.065737   0.332463  -0.00028
  7  C      0.065737  -0.467165  -0.000416
  8  C      0.065737  -0.266726  -0.00028
  9  C      0.267281  -0.066308  -0.000652
 10  C      0.267563   0.133782  -0.00046
 11  C      0.267281   0.333588  -0.000652
 12  C      0.265303  -0.467684  -0.000598
 13  C      0.265303  -0.266999  -0.000598
 14  C      0.46534   -0.066598  -0.000378
 15  C      0.467883   0.133803  -0.000516
 16  C      0.467883   0.334079  -0.000516
 17  C      0.46534   -0.468049  -0.000378
 18  C      0.462232  -0.268918   9.2e-05
 19  C     -0.349876  -0.065801   0.001318
 20  C     -0.333112   0.131894   0.000118
 21  C     -0.332735   0.333666  -0.000232
 22  C     -0.333112  -0.465005   0.000118
 23  C     -0.349876  -0.284075   0.001318
 24  C     -0.050103  -0.134189   0.001308
 25  C     -0.050103   0.084085   0.001308
 26  C     -0.066867   0.265098   0.000116
 27  C     -0.067244   0.466412  -0.00023
 28  C     -0.066867  -0.331965   0.000116
 29  C      0.134676  -0.133428  -0.000382
 30  C      0.137784   0.068892   8.2e-05
 31  C      0.134676   0.268104  -0.000382
 32  C      0.132133   0.465881  -0.000514
 33  C      0.132133  -0.333748  -0.000514
 34  C      0.332735  -0.133718  -0.00065
 35  C      0.334713   0.066973  -0.0006
 36  C      0.334713   0.26774   -0.0006
 37  C      0.332735   0.466453  -0.00065
 38  C      0.332453  -0.333808  -0.000454
 39  C     -0.472686  -0.133587   0.000272
 40  C     -0.465716   0.066737  -0.000278
 41  C     -0.465716   0.267176  -0.000418
 42  C     -0.465716   0.467533  -0.000278
 43  C     -0.472686  -0.339098   0.000272
 44  C     -0.269541   0.064441   0.000902
 45  C     -0.266621   0.265849  -5.6e-05
 46  C     -0.266621   0.467597  -5.6e-05
 47  C     -0.269541  -0.333982   0.000902
 48  S     -0.330381  -0.16519    0.00359
 49  S     -0.069975  -0.034988   0.003576
The ‘transport’ module
Currently 2 basic (parent) classes are defined in this module, including transport.Tensor for ‘tensor-like’ thermoelectric properties and transport.Distribution for distribution functions.
The ‘Tensor’-based classes
Child classes include: Kappa, Sigma, Seebeck, SigmaS, PowerFactor and ZT.
Basic I/O with the from_file class method. The user can call either the Tensor class or child classes.
Calling Tensor for the optimal flexibility.
[2]:
from CRYSTALpytools.transport import Tensor

obj = Tensor.from_file('trans_G2S_SG.DAT')
print('Object type: {}'.format(obj.type))
Object type: SIGMA
Calling the child classes for safety. The following code leads to error.
[3]:
from CRYSTALpytools.transport import Seebeck

obj = Seebeck.from_file('trans_G2S_SG.DAT')
---------------------------------------------------------------------------
TypeError                                 Traceback (most recent call last)
Cell In[3], line 3
      1 from CRYSTALpytools.transport import Seebeck
----> 3 obj = Seebeck.from_file('trans_G2S_SG.DAT')

File ~/apps/anaconda3/envs/crystal_py3.9/lib/python3.9/site-packages/CRYSTALpytools/transport.py:688, in Seebeck.from_file(cls, file, output)
    685 from CRYSTALpytools.crystal_io import Properties_output
    687 obj = Properties_output(output).read_transport(file)
--> 688 if obj.type.upper() != 'SEEBECK': raise TypeError('Not a SEEBECK.DAT file.')
    689 return obj

TypeError: Not a SEEBECK.DAT file.
With the PowerFactor.from_file() class method, the user can get ‘POWERFACTOR’ type (\(S^{2}\sigma\)) from 2 arbitrary types in ‘SIGMA’, ‘SIGMAS’ and ‘SEEBECK’. The sequence is arbitrary.
[4]:
from CRYSTALpytools.transport import PowerFactor

obj = PowerFactor.from_file('trans_G2S_SG.DAT', 'trans_G2S_SGS.DAT', output='trans_G2S.out')
print('Object type: {}'.format(obj.type))
print('Object unit: {}'.format(obj.unit))
Object type: POWERFACTOR
Object unit: W/m/K^2
Similarly, with ZT.from_file() the user can get ‘ZT’ type (thermoelectric dimensionless figure of merit, \(\frac{S^{2}\sigma T}{\kappa}\)) from 1 ‘KAPPA’ type file and 2 arbitrary ones from ‘SIGMA’, ‘SIGMAS’ and ‘SEEBECK’. The sequence is arbitrary.
[5]:
from CRYSTALpytools.transport import ZT

obj = ZT.from_file('trans_G2S_SG.DAT', 'trans_G2S_SGS.DAT', 'trans_G2S_K.DAT', output='trans_G2S.out')
print('Object type: {}'.format(obj.type))
print('Object unit: {}'.format(obj.unit))
Object type: ZT
Object unit: dimensionless
With the plot() method one can visualize object. By defult it plots the property along the ‘xx’ direction as the function of chemical potential \(\mu\). In that case, multiple data at different temperatures can be plotted as ‘series’.
Specifing the temperature values by plot_series.
[6]:
from CRYSTALpytools.transport import Sigma

obj = Sigma.from_file('trans_G2S_SG.DAT')
fig = obj.plot(plot_series=[300, 360, 420, 480])
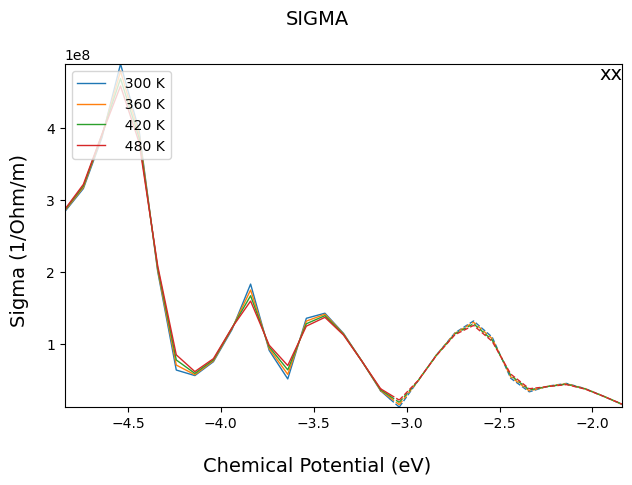
The logic of setting plot parameters is similar to density plots (see examples of electronics.ElectronDOS), which is not repeated again here.
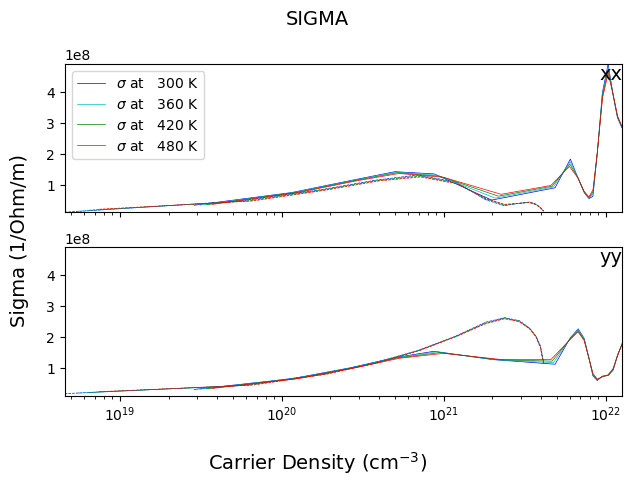
With x_axis='carrier', the user can plot data as function of carrier densities. Temperature is also used as plot series. direction=['xx', 'yy'] plots tensor properties along different directions into different subplots.
[7]:
fig = obj.plot(x_axis='carrier', plot_series=[300, 360, 420, 480],
               direction=['xx', 'yy'], plot_label=r'$\sigma$ at',
               plot_linewidth=0.5, plot_color=['b', 'c', 'g', 'r'])
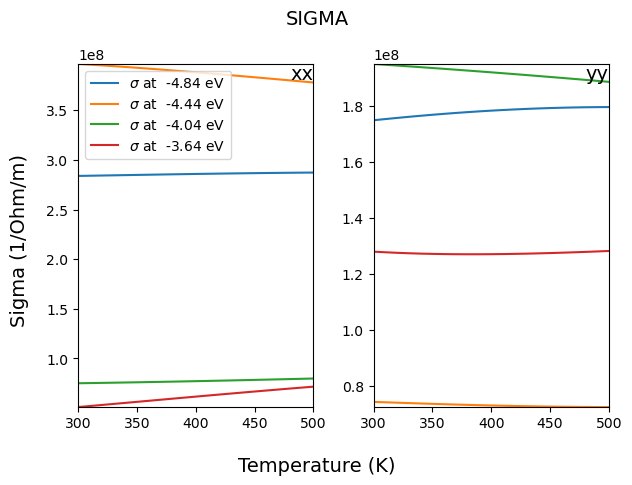
x_axis='temperature' plots the property as the function of temperature. Correspondingly, the plot series becomes chemical potential.
[8]:
fig = obj.plot(x_axis='temperature', plot_label=r'$\sigma$ at',
               direction=['xx', 'yy'], layout=[1,2], sharey=False,
               plot_linewidth=1.5, plot_series=[-4.84, -4.44, -4.04, -3.64])
The ‘Distribution’-based class
Child classes include: TDF
Currently only the I/O method is defined for this class.
[9]:
from CRYSTALpytools.transport import TDF

obj = TDF.from_file('trans_G2S_TDF.DAT', output='trans_G2S.out')
print('Object type: {}'.format(obj.type))
print('Object unit: {}'.format(obj.unit))
Object type: TDF
Object unit: 1/hbar^2*eV*fs/angstrom
The ‘plot_transport_tensor()’ method
The plot.plot_transport_tensor() method is designed for multi-system plots of tensor-like properties. It can also be used as a shortcut to plot data from file just as the Tensor.plot method.
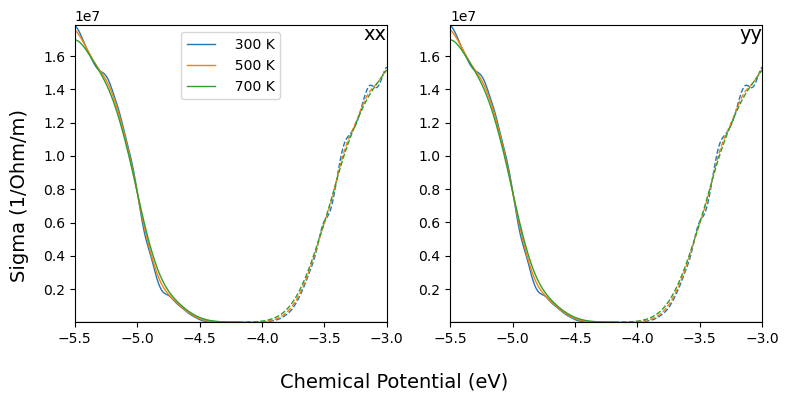
Normal usage with option='normal' and 1 property.
[9]:
from CRYSTALpytools.plot import plot_transport_tensor

fig = plot_transport_tensor('trans_Bi2Te3_SG.DAT', x_range=[-5.5, -3],
                            direction=['xx', 'yy'], figsize=[8, 4],
                            layout=[1, 2], sharey=False, legend='upper center')
Get power factor with a 1D list of 2 elements.
[10]:
from CRYSTALpytools.plot import plot_transport_tensor

fig = plot_transport_tensor(['trans_Bi2Te3_SG.DAT', 'trans_Bi2Te3_SK.DAT'],
                            option='normal', x_axis='carrier',
                            direction=['xx', 'yy'], figsize=[8, 4],
                            layout=[1, 2], sharey=False)
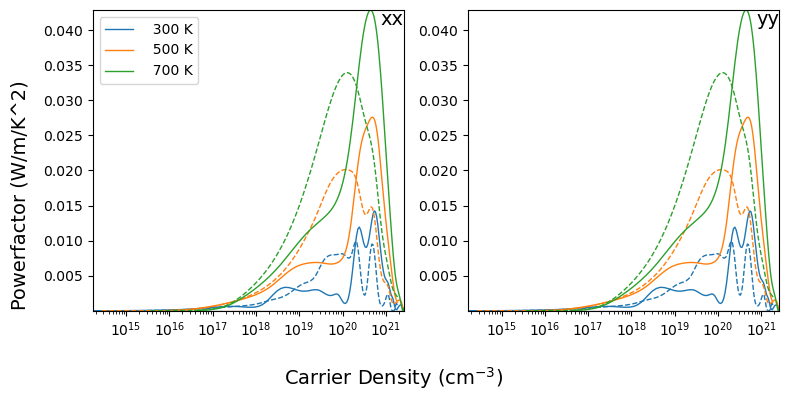
Plot power factor and Seebeck coefficient of Bi2Te3 together. In this case, option='normal' plots multiple properties at various ‘plot series’ along various directions.
Assuming every property is a ‘block’, the layout option specifies the layout of blocks. The layout within block is always nDirection*1. Similarly, sharey defines the y-axis within the same block.
[11]:
fig = plot_transport_tensor(
    'trans_Bi2Te3_SK.DAT', ['trans_Bi2Te3_SG.DAT', 'trans_Bi2Te3_SK.DAT'],
    option='normal', x_axis='carrier', direction=['xx', 'yy', 'zz'],
    figsize=[8, 6], layout=[1, 2], sharey=True)
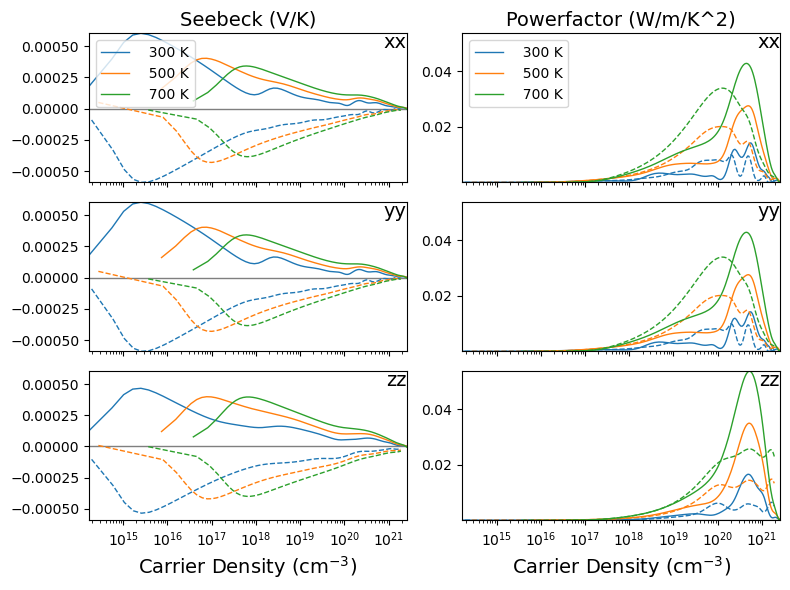
Compare data of 2 different materials with option='multi'.
NOTE
The entries must be of the same type, same dimensionality.
Multi-direction plotting is disabled.
directiononly accepts string input.Instead,
plot_seriesis used to generate subplots.This function accepts inconsistent plot series. The common plot series is found automatically. See the example below.
With x_axis='potential', temperature is used as plot series.
[12]:
from CRYSTALpytools.transport import Tensor
from CRYSTALpytools.plot import plot_transport_tensor

obj1 = Tensor.from_file('trans_TiNiSn_SK.DAT')
obj2 = Tensor.from_file('trans_Bi2Te3_SK.DAT')

print('Obj1 Temperature:')
print(obj1.T)
print('Obj2 Temperature:')
print(obj2.T)

fig = plot_transport_tensor(
    obj1, obj2, option='multi', x_axis='potential', plot_label=['TiNiSn', 'Bi2Te3'],
    title='Seebeck Coeff.', direction='xx', figsize=[8, 5], x_range=[-6, -3],
    layout=[1, 3]
)
Obj1 Temperature:
[300. 400. 500. 600. 700.]
Obj2 Temperature:
[300. 500. 700.]
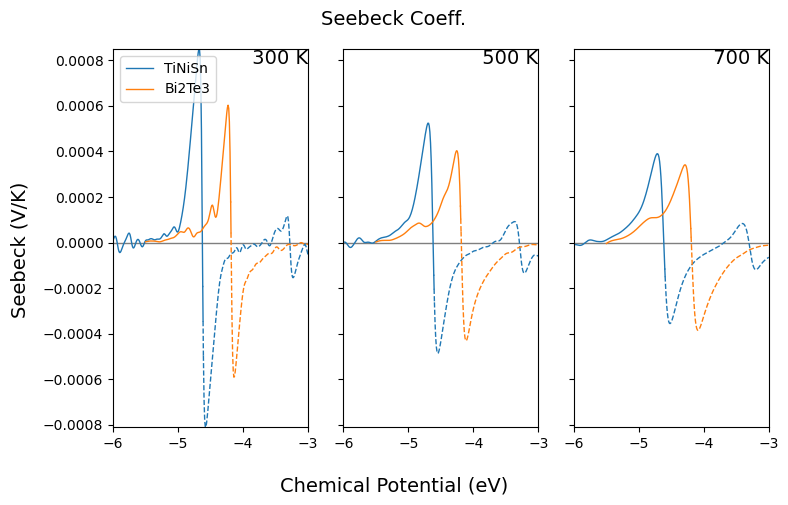
For more details please refer to the API documentations.