Electronic Structure
Here code examples for electron band structure, density of states (DOS) are given. For dispersions of E(k) across the first Brillouin zone, please refer to the Fermi Surface examples.
‘read_electron_band()’ and ‘read_electron_dos()’ methods
Both methods are defined in the crystal_io.Properties_output class, which read formatted output files generated by CRYSTAL and return to electronics.ElectronBand and electronics.ElectronDOS classes. Both methods accept Crgra2006 (fort.25) and Xmgrace files (BAND.DAT, DOSS.DAT).
The standard output is not required for plotting, the geometry information is required during analysis. The output of properties calculation can be specified during object instantiation.
[1]:
from CRYSTALpytools.crystal_io import Properties_output

mgoband = Properties_output('band_mgo.outp').read_electron_band('band_mgo.BAND')

print('MgO energy unit = {}'.format(mgoband.unit))
print('MgO Fermi energy = {:.2f}'.format(mgoband.efermi))
print('MgO reciprocal lattice:')
print(mgoband.reciprocal_latt)
MgO energy unit = eV
MgO Fermi energy = -4.14
MgO reciprocal lattice:
[[-1.48996569  1.48996569  1.48996569]
 [ 1.48996569 -1.48996569  1.48996569]
 [ 1.48996569  1.48996569 -1.48996569]]
Currently no geometry information is added to the ElectronDOS object.
[2]:
mgodoss = Properties_output().read_electron_dos('doss_mgo.DOSS')

print('MgO energy unit = {}'.format(mgodoss.unit))
print('MgO Fermi energy = {:.2f}'.format(mgodoss.efermi))
print('MgO DOS projections = {}'.format(len(mgodoss.doss)))
MgO energy unit = eV
MgO Fermi energy = -4.14
MgO DOS projections = 3
‘electronics’ module
The electronics module includes object-oriented methods for data analysis and quick plotting.
‘ElectronBand’ object
The user can instantiate a ElectronBand object by directly calling the from_file class method.
[3]:
from CRYSTALpytools.electronics import ElectronBand

mgoband = ElectronBand.from_file('band_mgo.BAND', 'band_mgo.outp')
Basic properties can be analyzed with its methods. For band positions, when 3D k path is available, return to 3D cartesian coordinates.
[4]:
mgoband.get_bandgap()
print('Band gap of MgO = {:.2f} {}'.format(mgoband.gap, mgoband.unit))
print('CBM to Fermi level = {:.2f}'.format(mgoband.cbm))
print('3D VBM position = {:.2f} {:.2f} {:.2f}'.format(mgoband.gap_pos[0, 0],
                                                      mgoband.gap_pos[0, 1],
                                                      mgoband.gap_pos[0, 2]))
print('3D CBM position = {:.2f} {:.2f} {:.2f}'.format(mgoband.gap_pos[1, 0],
                                                      mgoband.gap_pos[1, 1],
                                                      mgoband.gap_pos[1, 2]))
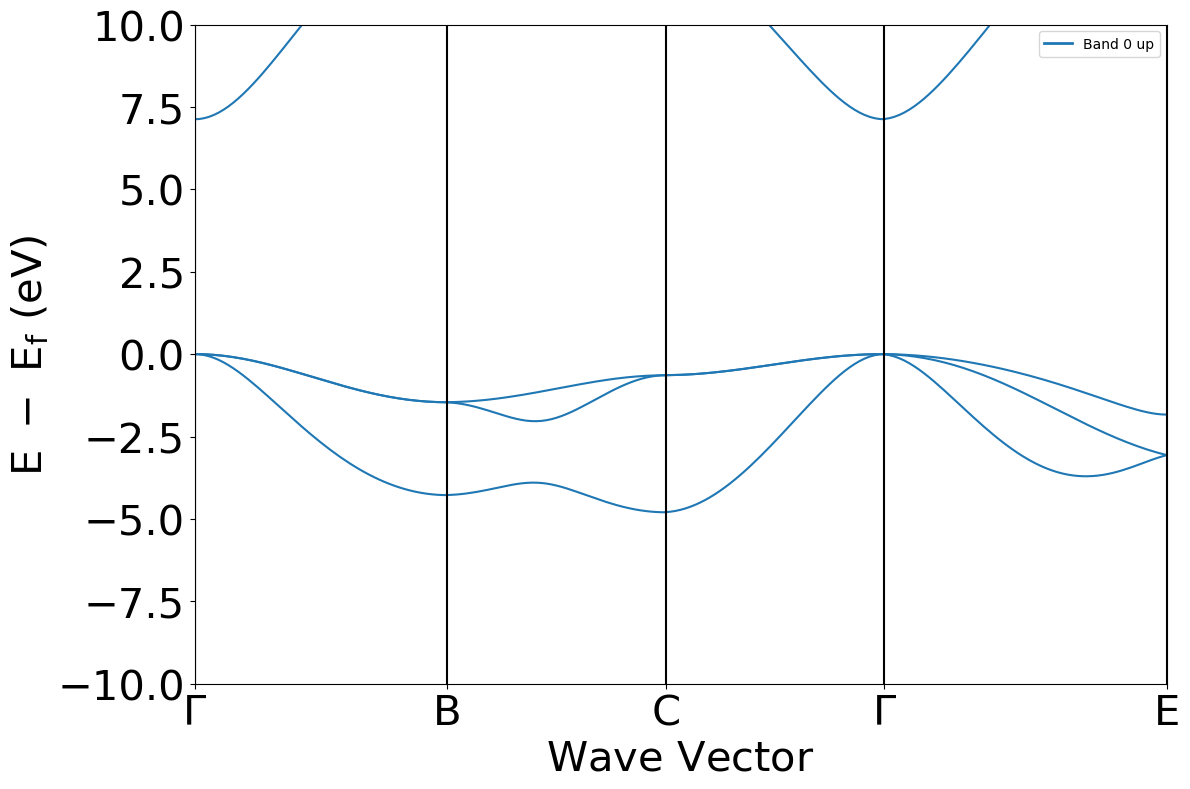
Band gap of MgO = 7.12 eV
CBM to Fermi level = 7.12
3D VBM position = 0.00 0.00 0.00
3D CBM position = 0.00 0.00 0.00
When geometry information is available, the user can convert the ElectronBand object into the pymatgen ‘BandStructureSymmLine’ object for further analysis.
[5]:
from pymatgen.electronic_structure.plotter import BSPlotter

pmgband = mgoband.to_pmg(labels=[r'$\Gamma$', 'B', 'C', r'$\Gamma$', 'E'])
bsplot = BSPlotter(pmgband)
bsplot.get_plot(ylim=(-10, 10), zero_to_efermi=True)
[5]:
<Axes: xlabel='$\\mathrm{Wave\\ Vector}$', ylabel='$\\mathrm{E\\ -\\ E_f\\ (eV)}$'>
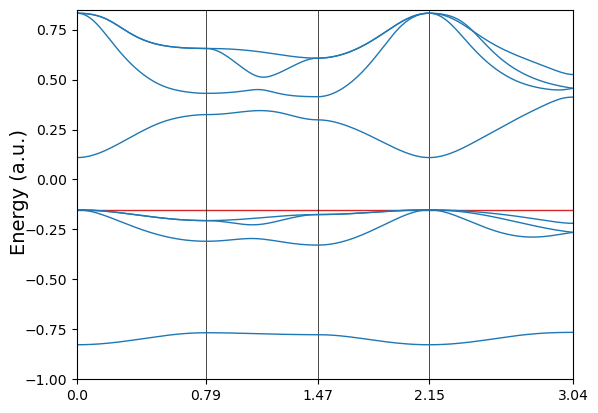
Of course the user can also do a quick plot by calling the plot method. It also allows for finer adjustments of band structure plot. Here the band structure of MgO is replotted in Hartree unit with energy aligned to vacuum.
[6]:
fig = mgoband.plot(unit='a.u.',  energy_range=[-1.0, 0.85],
                   fermi_color='tab:red', fermi_level=mgoband.efermi,)
‘ElectronDOS’ object
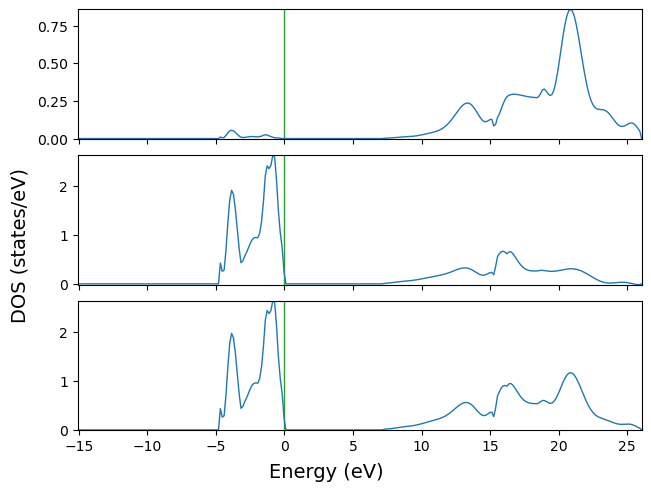
Similarly, the ElectronDOS object can be instantiated and plotted.
[7]:
from CRYSTALpytools.electronics import ElectronDOS

mgodoss = ElectronDOS.from_file('doss_mgo.DOSS')
fig = mgodoss.plot(sharey=False)
‘ElectronBandDOS’ object
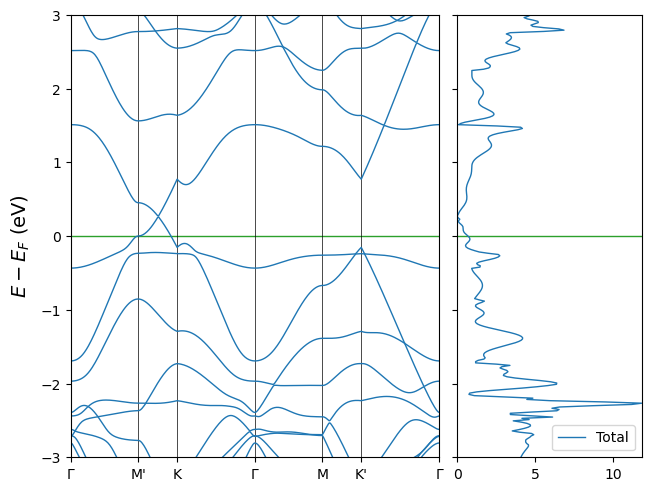
This is an object combining ElectronBand and ElectronDOS. It can be instantiated by 2 files (band first) or a single ‘fort.25’ file with both band and DOS data.
[8]:
from CRYSTALpytools.electronics import ElectronBandDOS

es = ElectronBandDOS.from_file('es_grapheneDV.f25')
fig = es.plot(k_label=[r'$\Gamma$', "M'", 'K', r'$\Gamma$', 'M', "K'", r'$\Gamma$'],
              energy_range=[-3, 3], dos_prj=[-1], dos_label='Total')
/home/huanyu/apps/anaconda3/envs/crystal_py3.9/lib/python3.9/site-packages/CRYSTALpytools/electronics.py:75: UserWarning: Properties output file not found: 3D k path not available.
  return Properties_output(output).read_electron_band(band)
‘plot.plot_electron_bands’ function
The plot.plot_electron_bands() function enables a higher-level of plotting. It accepts extendable length of ‘fort.25’ / ‘BAND.DAT’ files, or ElectronBand objects.
When files are used, warning message might be triggered as no screen output file is given and geometry information is not available. It is (currently) only useful when converting the object into pymatgen formats.
Single-system band structure
[9]:
import CRYSTALpytools.plot as cfplt

fig = cfplt.plot_electron_bands('band_hTaAs.BAND', energy_range=[-5, 5],
                                title='hTaAs', fermi_color='tab:red',
                                k_label=['Gamma', 'M', 'K', 'A', 'L', 'H', 'K'])
/home/huanyu/apps/anaconda3/envs/crystal_py3.9/lib/python3.9/site-packages/CRYSTALpytools/electronics.py:75: UserWarning: Properties output file not found: 3D k path not available.
  return Properties_output(output).read_electron_band(band)
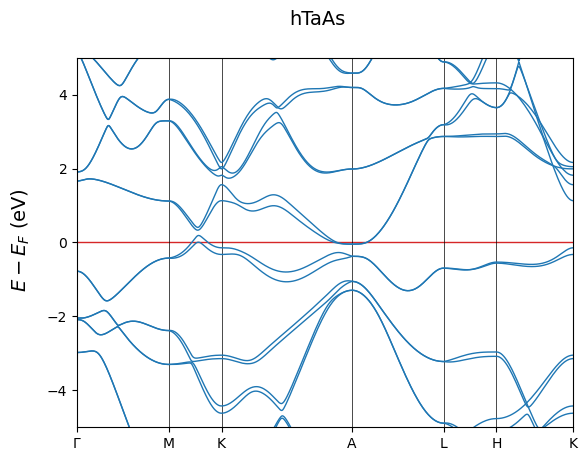
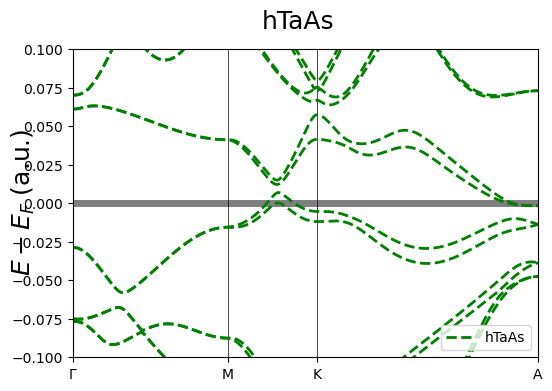
The user can customize their settings as has been shown in the previous sections. Here is another example.
[10]:
fig = cfplt.plot_electron_bands(
    'band_hTaAs.BAND', unit='a.u.', k_label=['Gamma', 'M', 'K', 'A', 'L', 'H', 'K'],
    energy_range=[-0.1, 0.1], k_range=['Gamma', 'A'],
    band_label='hTaAs', band_color='green', band_linestyle='--', band_linewidth=2,
    fermi_level=0., fermi_color='tab:gray', fermi_linestyle='-', fermi_linewidth=5,
    title='hTaAs', figsize=(6,4), fontsize=18)
/home/huanyu/apps/anaconda3/envs/crystal_py3.9/lib/python3.9/site-packages/CRYSTALpytools/electronics.py:75: UserWarning: Properties output file not found: 3D k path not available.
  return Properties_output(output).read_electron_band(band)
Multi-system Band Structures
With the plot_electron_bands() fuction you can plot multiple band structures in two ways:
'multi': Overlapping the structures'compare': Side by side plots
In both cases, the user can customize the plot settings just as in single-system plotting.
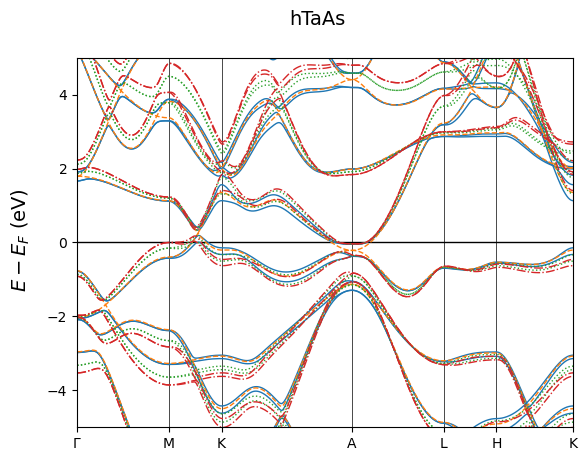
Here is an example of overlapped band structures of hTaAs under different pressures. Since the volume has changed, their K pathes are scaled. This is enforced when mode='multi'. Note here the plotting parameters should be given in lists with the same length as band structure inputs. Refer to module specific documentations for more information.
[11]:
Data = ['band_hTaAs.BAND', 'band_hTaAs_noso.BAND',
        'band_hTaAs_P15.BAND', 'band_hTaAs_P25.BAND']

fig = cfplt.plot_electron_bands(
    *Data, mode='multi', energy_range=[-5, 5], title='hTaAs',
    k_label=['Gamma', 'M', 'K', 'A', 'L', 'H', 'K'], fermi_color='k',
    band_label=['NOSOC', 'SCDFT', 'P15', 'P25'],
    band_linestyle=['-','--','dotted','dashdot'],
    legend=None
)
/home/huanyu/apps/anaconda3/envs/crystal_py3.9/lib/python3.9/site-packages/CRYSTALpytools/electronics.py:75: UserWarning: Properties output file not found: 3D k path not available.
  return Properties_output(output).read_electron_band(band)
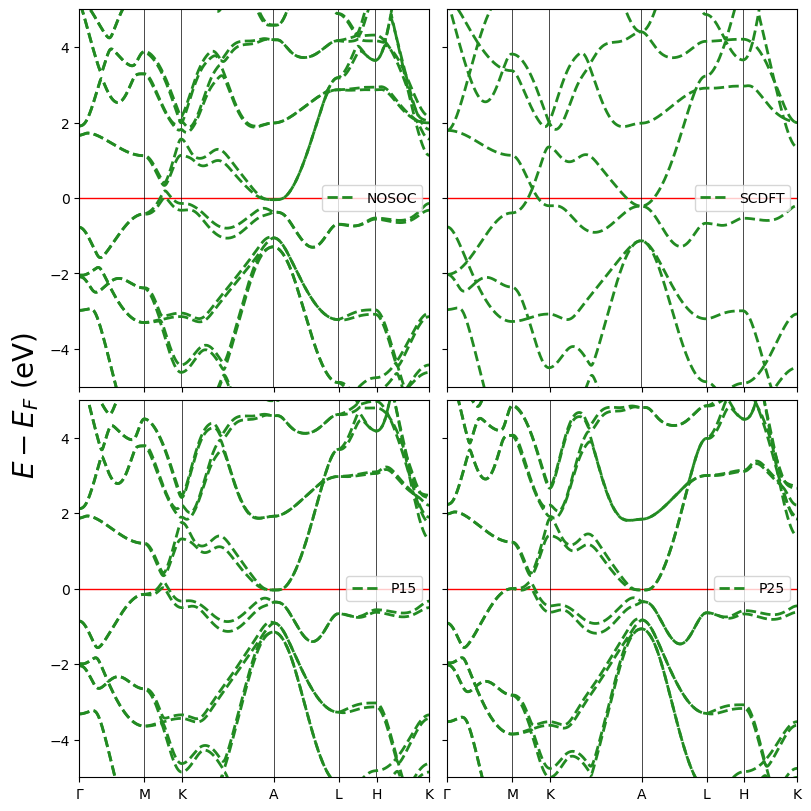
Here is an example of side-by-side plots, also customized. The displaying scheme is specified by layout=[2, 2]. The plotting parameters can be given in text or numbers, or 1*2 lists for spin-polarized systems. Refer to module specific documentations for more information.
[12]:
Data = ['band_hTaAs.BAND', 'band_hTaAs_noso.BAND',
        'band_hTaAs_P15.BAND', 'band_hTaAs_P25.BAND']

fig = cfplt.plot_electron_bands(
    *Data, mode='compare', energy_range=[-5, 5], layout=(2,2), fontsize=20,
    k_label=['Gamma', 'M', 'K', 'A', 'L', 'H', 'K'],
    band_label=['NOSOC', 'SCDFT', 'P15', 'P25'], band_color='forestgreen',
    band_linestyle='--', band_linewidth=2, fermi_color='red', figsize=(8,8),
    legend='center right'
)
/home/huanyu/apps/anaconda3/envs/crystal_py3.9/lib/python3.9/site-packages/CRYSTALpytools/electronics.py:75: UserWarning: Properties output file not found: 3D k path not available.
  return Properties_output(output).read_electron_band(band)
‘plot.plot_electron_doss’ function
The plot.plot_electron_doss() function enables a higher-level of plotting. It accepts extendable length of ‘fort.25’ / ‘DOSS.DAT’ files, or ElectronDOS objects.
Single-system DOS
By default a the DOS of a single system is plotted into separate subplots, depending on the number of projections.
[13]:
fig = cfplt.plot_electron_doss('doss_96.DOSS', sharey=False)
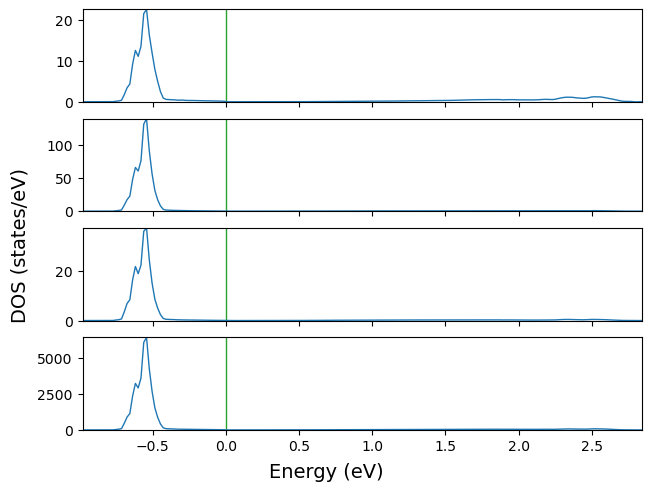
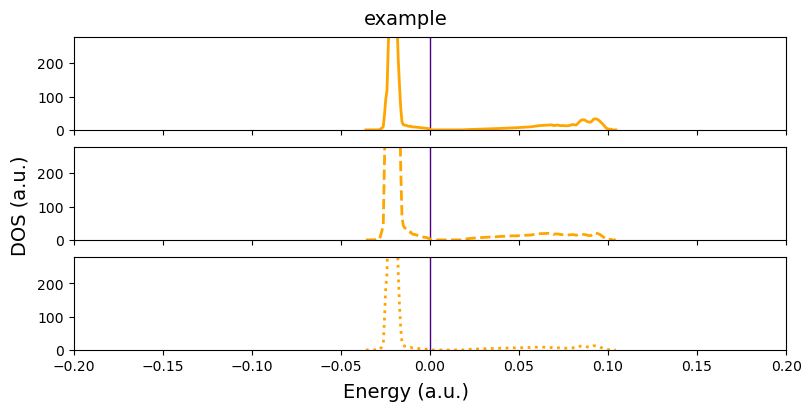
Similar to band structure, the user can customize of DOSS plots. Projections can be selected by the plt parameter (It starts from 1).
[14]:
fig = cfplt.plot_electron_doss(
    'doss_96.DOSS', title='example', figsize=(8,4),
    energy_range=[-0.2,0.2], dos_range=[0, 280], prj=[1,2,3],
    dos_color='orange', dos_linestyle=['-','--','dotted'], dos_linewidth=2,
    unit='a.u.', fermi_level=0., fermi_color='indigo' )
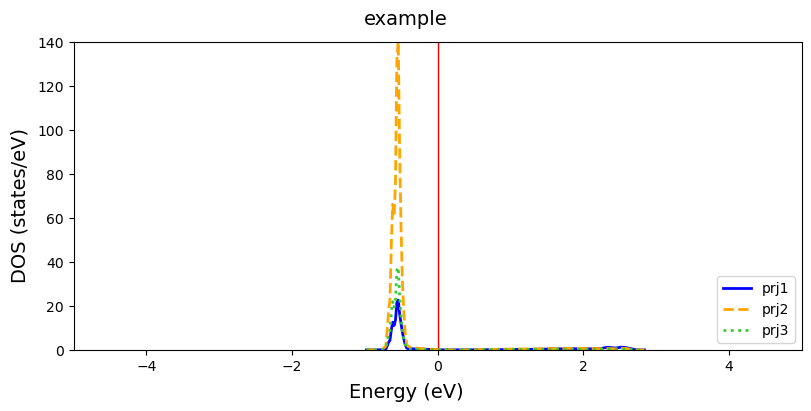
With overlap=True, multiple projections are ploted into the same panel.
[15]:
fig = cfplt.plot_electron_doss(
    'doss_96.DOSS', title='example', energy_range=[-5,5], prj=[1,2,3],
    overlap=True, dos_color=['blue', 'orange', 'limegreen'],
    dos_label=['prj1', 'prj2', 'prj3'],
    dos_linestyle=['-','--','dotted'], dos_linewidth=2, fermi_color='r',
    figsize=(8,4))
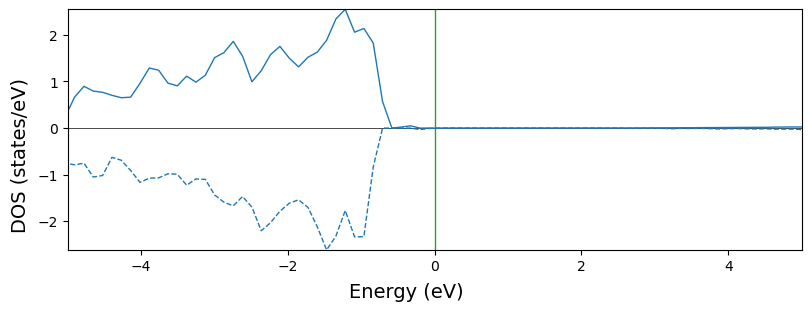
For spin-polarized systems, the user can either plot the \(\beta\) state on the same (beta='up', default) or the opposite side (beta=down).
[16]:
fig = cfplt.plot_electron_doss(
    'doss_cu.DOSS', prj=[4], figsize=(8, 2), energy_range=[-5, 5]
)

beta='down' and remove the legend by legend=None
[17]:
fig = cfplt.plot_electron_doss(
    'doss_cu.DOSS', prj=[4], figsize=(8, 3), energy_range=[-5, 5],
    beta='down', legend=None
)
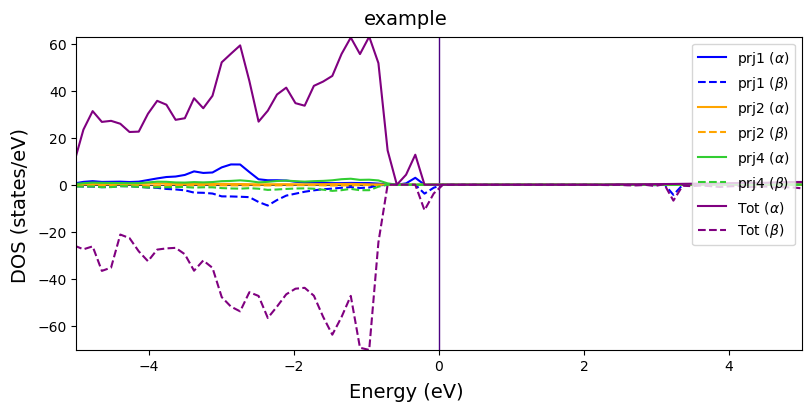
Multiple projections with overlap=True. The default line style becomes ‘solid’ for \(\alpha\) states and ‘dashed’ for \(\beta\) states.
Note when the system is spin polarized, all the line setting parameters should be nPrj*2 lists. The first entry for \(\alpha\) states and the second for \(\beta\) states. If 1D lists are given, the same style is used for both states. Therefore, it is not suggested to change dos_linestyle with 1D lists.
[18]:
fig = cfplt.plot_electron_doss(
    'doss_cu.DOSS', title='example', figsize=(8, 4), energy_range=[-5, 5],
    fermi_color='indigo', overlap=True, beta='down', dos_linewidth=1.5,
    dos_color=['blue', 'orange', 'limegreen', 'purple'],
    dos_label=['prj1', 'prj2', 'prj4', 'Tot'], prj=[1,2,4,5], legend='upper right'
)
Multi-system DOSs
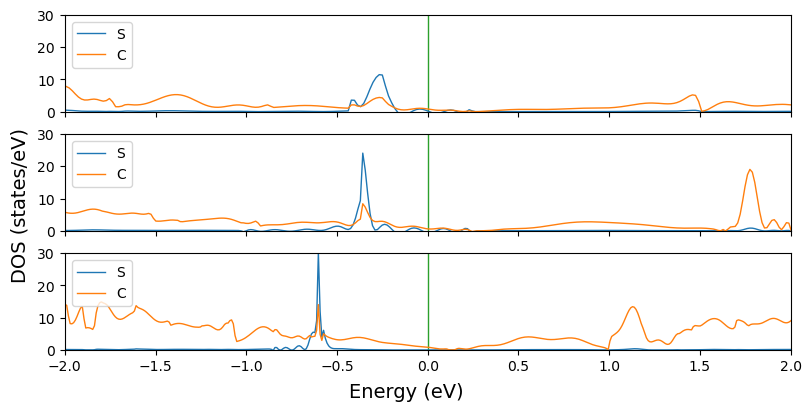
DOS of multiple systems can also be plotted with plot_electron_doss(). Every system is plotted into a subplot with their projections overlapped. The custimization settings applies to all the systems, so make sure that all the entries have the same number of projections.
[19]:
data = ['doss_grapheneDV4.DOSS',
        'doss_grapheneDV5.DOSS',
        'doss_grapheneDV8.DOSS']
fig = cfplt.plot_electron_doss(
    *data, figsize=(8, 4), prj=[1, 2], energy_range=[-2, 2], dos_range=[0, 30],
    dos_label=['S', 'C'], legend='upper left'
)
‘plot.plot_electron_banddos’ function
The plot.plot_electron_banddos() function helps to plot combined band structure - vertical DOS plots for electron structure analysis. It only accepts single-system band and DOS plots.
For inputs, it accepts 2 entries with the first one for band (‘fort.25’/’BAND.DAT’/ElectronBand) and the second for DOS (‘fort.25’/’DOSS.DAT’/ElectronDOS). Alternatively it also accepts 1 entry of a combined ‘fort.25’ (as shown in previous sections) or a ElectronBandDOS object.
Overlapped DOS
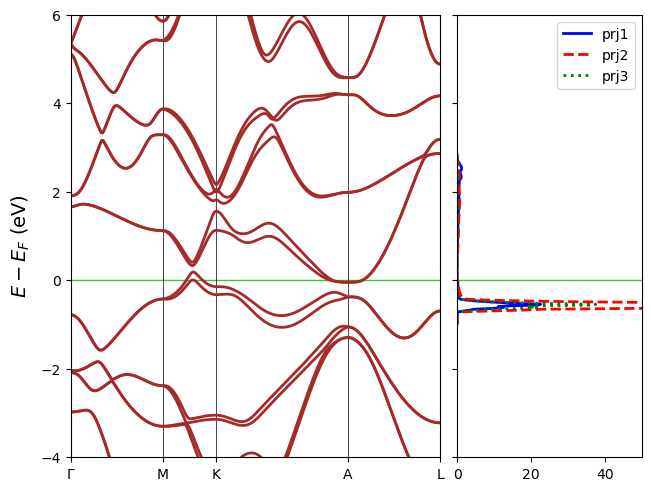
While only one band is plotted on the left, multiple projections of DOS can be plotted on the right. Projections can be specified with dos_prj and range can be specified with dos_range.
[20]:
fig = cfplt.plot_electron_banddos(
    'band_hTaAs.BAND', 'doss_96.DOSS',
    k_label=['Gamma', 'M', 'K', 'A', 'L', 'H', 'K'], k_range=['Gamma', 'L'],
    dos_overlap=True, dos_linewidth=2, dos_range=[0, 50],
    dos_linestyle=['-', '--', 'dotted'],
    dos_label=['prj1', 'prj2', 'prj3'], dos_prj=[1,2,3],
    dos_color=['blue', 'red', 'green'],
    band_color='brown', band_linestyle='-', band_linewidth=2,
    fermi_color='limegreen', energy_range=[-4,6],
    legend='upper right'
)
/home/huanyu/apps/anaconda3/envs/crystal_py3.9/lib/python3.9/site-packages/CRYSTALpytools/electronics.py:75: UserWarning: Properties output file not found: 3D k path not available.
  return Properties_output(output).read_electron_band(band)
Multi-panel DOS
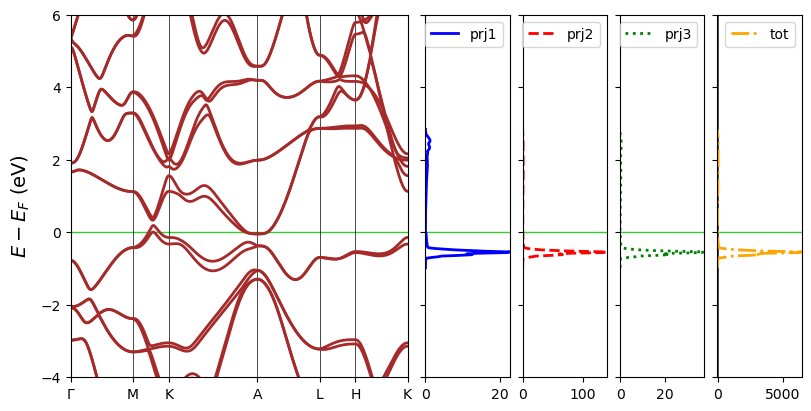
DOS projections can also be plotted in separate panels. In that sense dos_overlap=False. In case that the figure is too long, band_width can be set to control the width of the band panel in times of a DOS panel.
[21]:
fig = cfplt.plot_electron_banddos(
    'band_hTaAs.BAND', 'doss_96.DOSS',
    k_label=['Gamma', 'M', 'K', 'A', 'L', 'H', 'K'],
    dos_overlap=False, dos_linewidth=2,
    dos_linestyle=['-', '--', 'dotted', 'dashdot'],
    dos_label=['prj1', 'prj2', 'prj3', 'tot'],
    dos_color=['blue', 'red', 'green', 'orange'],
    band_width=4, band_color='brown', band_linestyle='-', band_linewidth=2,
    fermi_color='limegreen', energy_range=[-4,6], figsize=(8,4),
    legend='upper right'
)
/home/huanyu/apps/anaconda3/envs/crystal_py3.9/lib/python3.9/site-packages/CRYSTALpytools/electronics.py:75: UserWarning: Properties output file not found: 3D k path not available.
  return Properties_output(output).read_electron_band(band)
For more details, please refer to API documentations.